Legal Notices
Chapter 1:
Quick Start
Chapter 2:
Introduction and Installation
Chapter 3:
About Memory Analysis
Chapter 4:
Finding Memory Leaks
Chapter 5:
Finding Memory Errors
Chapter 6:
Startup Options
Chapter 7:
Viewing Error Messages
Chapter 8:
Viewing Source Code
Chapter 9:
Tips and Techniques
Chapter 10:
Troubleshooting
Chapter 11:
Obtaining Support
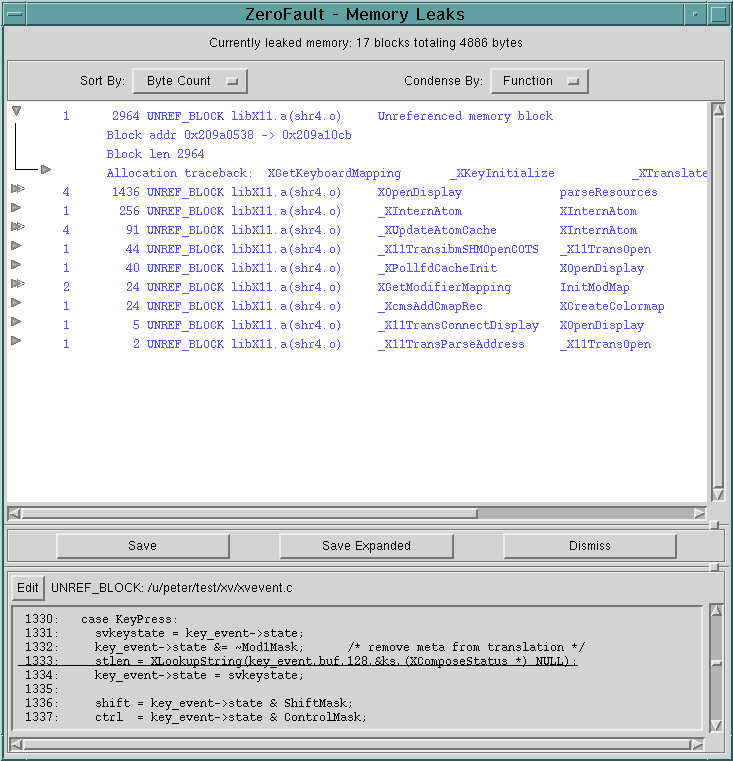
Finding Memory LeaksMemory leaks occur when an application allocates memory but does not free it when it is finished using the memory. Typically the allocation is done via malloc and the free is done via free, either directly or indirectly (as with the C++ new and delete keywords). Memory leaks cause programs to consume excessive memory (paging space), and eventually the program may be killed by the kernel for consuming too much memory. In the meantime, the excessive memory use may degrade system performance so severely that other programs are effectively shut down.Physical and Logical Memory LeaksThere are two types of memory leaks, physical and logical. Physical memory leaks occur when the program allocates memory and then loses the reference to it, as in the following example:
	#include <stdio.h>
	#include <string.h>
	main()
	{
		char buf[BUFSIZ], *t, *t_save;

		while (fgets(buf, sizeof(buf), stdin)) {
			t_save = t = strdup(buf);
			t = strtok(t, " \t");
			printf("first word is '%s'\n", t);
			printf("whole line is '%s'\n", buf);
			/* should free t_save here */
		}
	}
In this case, the pointers to all but the last allocated block of memory
are overwritten, so there is no way to free them.
This is the "classic" memory leak, the kind that garbage collection
algorithms can find for you. ZeroFault's
garbage collector does just that, with a single click.
Logical memory leaks occur when the program still has a reference to an allocated block, but it no longer needs it, and should therefore free it. For example, consider a server program that builds a linked list of objects representing client requests. Normally it frees a request object when it finishes processing it, but if an error occurs when responding to the client (e.g. the client has disconnected), the logic in the error path neglects to free the object. In this case there is still a reference to the allocated block (the "next" pointer from the previous object in the list), but the object is dead and will never be used again. Logical leaks are at least as common as physical ones, and their impact on the system is just as severe. Unfortunately, they cannot be detected by garbage collectors, so another technique is required to catch them. ZeroFault provides the ability to instantly take and compare snapshots of currently allocated memory, which makes it very easy to pin down logical memory leaks. Note that ZeroFault detects leaks in memory that is allocated and managed via the standard C library functions malloc, realloc and free. This also covers the C++ operators new and delete because they resolve to the C library functions. On the other hand, ZeroFault does not track memory allocated via mmap, shmat, or custom memory allocation functions for the purposes of detecting leaks. Finding Physical Memory LeaksZeroFault finds physical memory leaks by using a garbage collection algorithm to locate blocks of allocated memory that are no longer referenced by the process. ZeroFault uses a standard "mark and sweep" garbage collection algorithm that recursively examines the program's memory regions for pointers to memory blocks. If a pointer to a memory block is found then that block is considered to be referenced and it in turn is searched for pointers. This process recurses until all blocks for which there are pointers have been found. Any blocks that are currently allocated, but for which there are no pointers found, are considered to be memory leaks. This is because if there is no pointer to the block then it is theoretically impossible (or at least very difficult) to access the block to use the memory or free it. The list of blocks for which there exist no pointers is called the list of "unreferenced blocks".Garbage collection is very easy to use. When the program is running, you can press the Find Leaks button from the ZeroFault user interface. ZeroFault halts program execution and performs garbage collection, and presents a list of all of the unreferenced blocks found:
You can use the Sort and Condense menus to view the list in different ways. You can save the list to a file using the Save and Save Expanded buttons; the Save button saves the list as it currently appears on the screen, while the Save Expanded button saves the list fully expanded, with all the tracebacks and block information included. After the process exits, ZeroFault automatically performs garbage collection to search for memory leaks. The Find Leaks button on the GUI turns into the Show Leaks button; pressing it produces a report of unreferenced blocks found at process exit. Note that if there is a pointer to a block contained in an automatic variable in main, that pointer is no longer in scope after main returns and therefore the block referenced by that pointer will be considered a memory leak. Limitations of Garbage Collection Algorithms The second limitation of garbage collection is that sometimes a pointer can be manipulated so that it is not found during garbage collection, causing false positive reports of unreferenced blocks. For example, if a block of memory is allocated and the returned pointer is stored in a file and the memory copy of it is destroyed, a garbage collector will find no reference to the allocated block, and it will consider it to be dead memory. When using the garbage collection feature of ZeroFault, this would result in a false report of a leaked block. Both of these limitations are unusual occurrences, and garbage collection can be used in the vast majority of cases to find all unreferenced blocks--i.e., all physical memory leaks. But in cases where the garbage collection logic reports false positive or negatives, or where you are looking for logical memory leaks, the snapshot technique described in the following section provides a definitive means of finding all leaked memory. Finding Logical Memory LeaksThere are many cases where memory may be referenced by a pointer, but it is still a logical leak--i.e., it should have been freed. The example given above was of failing to delete an element from a linked list; another example is not harvesting threads when they complete execution. In these cases, memory continues to grow, and it will eventually cause the system performance to degrade and the system will finally kill the process. These logical memory leaks are usually very hard to find, but ZeroFault makes it simple. Using the snapshot technique, you can take snapshots that show all the memory that the process has allocated at a given point in time. You can then compare two or more snapshots to determine which memory was allocated and deallocated between the two points in time, which gives you a comprehensive view of the program's dynamic memory usage. Taking and Displaying Snapshots
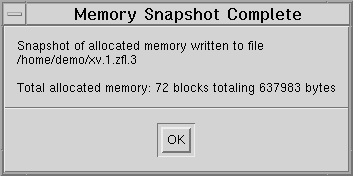
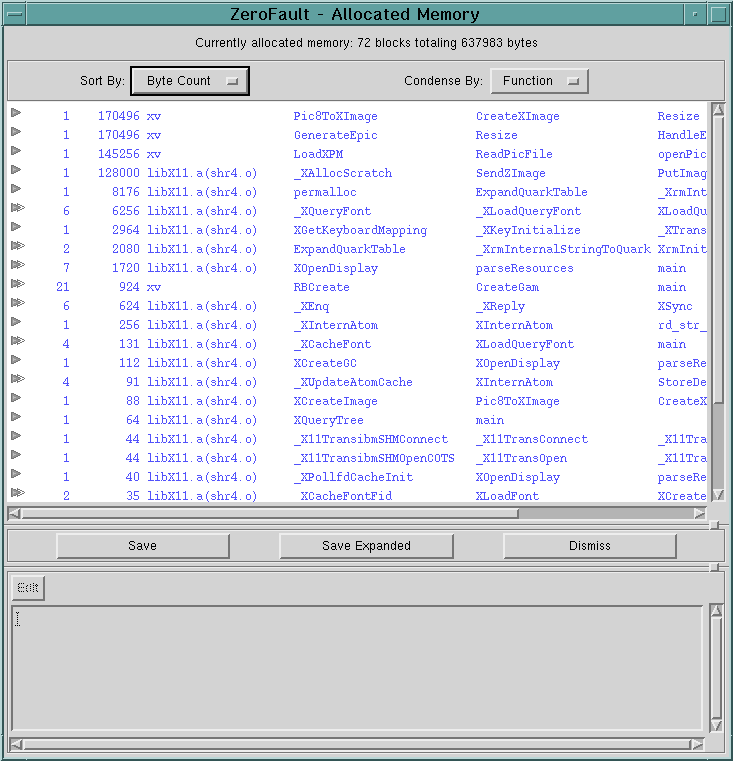
The snapshot file is an ASCII file with one line per allocated block. Each line in the file starts with the module name of the allocating function, which is followed by the stack traceback that shows the allocating function and its callers. The module name and traceback functions are separated by pipe ("|") characters. The last field on the line consists of the block address and size, in both hex and decimal. The last line of the file shows the total allocated blocks and bytes. The snapshot file is named <program>.<n>.zfl.<m> where <program> and <n> have their normal meanings and <m> is the number of the snapshot, incrementing from 1. If you are using the GUI, you don't need to ever look at the snapshot file itself--instead, you can use the GUI features to display the snapshot file or compare two snapshots and display the differences between them. You can use the Display Snapshot button to read a snapshot file and display it on the screen, allowing you to view where the memory is allocated. Just as in the other GUI displays, you can expand and contract each report, showing either the summary data or the complete data, including block address and length and the allocation traceback. You can sort and condense the allocated blocks by various attributes, allowing you to view the data in different ways and make sense of large reports. You can also save the displayed data in either the currently displayed form or fully expanded. If you simply want to view the currently allocated memory but don't care about saving it in a file, you can just press the Display Memory button. This displays the currently allocated memory blocks and gives you the same output as if you used the Take Snapshot and Display Snapshot buttons together:
And since the Display Snapshot and Compare Snapshot features can read both the snapshot file format and the Save Expanded file format, you can use the Save Expanded button on any memory display window to save the displayed memory blocks in a form that can be later viewed or compared using the Display and Compare Snapshots features. Comparing Snapshots to Find Leaks The typical way to use the memory snapshot feature is to allow your program to get to a quiet state where all initialization has been completed and perhaps some number of operations have already been performed. Take the first snapshot at this point. Then perform an operation that is suspected of causing a memory leak and take the second snapshot when it is completed. Comparing the two snapshot files will then show you all the memory that was allocated in performing the final operation, which should pinpoint both physical and logical memory leaks that might have occurred during that time. Finding Logical Memory Leaks from the
Command Line To demonstrate this technique we will apply it to the aixterm command as shipped on AIX 4.1.4. There is a small memory leak when aixterm is resized. If resized a sufficient number of times, the ps command would show an increase in the size of the aixterm process. $ zf aixterm & [1] 31404 [ Allow aixterm to get started and display a command line prompt and then resize it a couple of times. ] $ kill -54 31404 [ Sending signal 54 to aixterm takes a snapshot of aixterm's allocated memory and writes that snapshot to the file aixterm.1.zfl.1 ] [ Now resize aixterm again, allow it to redraw itself, then shrink it to the original dimensions and take another snapshot. ] $ kill -54 31404 [ To view the difference in the number of blocks that were added between snapshots, we sort and diff the two files. Note that we use the cut command to limit the width of the output for the purposes of this example. ] $ sort aixterm.1.zfl.1 > aixterm.1.sorted $ sort aixterm.1.zfl.2 > aixterm.2.sorted $ diff aixterm.1.sorted aixterm.2.sorted | cut -c-80 5c5 < Total memory allocated: 3851 blocks totaling 601687 --- > Total memory allocated: 3855 blocks totaling 602331 1129a1130 > aixterm | ScreenResize +0x00590(1424) | VTConfigure +0x00158( 2158a2160 > aixterm | ScreenResize +0x005bc(1468) | VTConfigure +0x00158( 3190a3193,3194 > aixterm | ScreenResize +0x00c54(3156) | VTConfigure +0x00158( > aixterm | ScreenResize +0x00d3c(3388) | VTConfigure +0x00158(The output of diff shows that aixterm had four more blocks allocated at the time of the second snapshot than it did at the time of the first snapshot, and that these blocks correspond to an additional 644 bytes of memory. The output also shows the allocation traceback for the new blocks, which enables you to track down the leak. Finding Allocated Memory at ExitAnother feature of ZeroFault allows you to report on all the blocks of memory that are allocated when the process exits. In a perfectly behaved program there should be no allocated blocks at exit time, since they should have all been freed before exiting. Of course most programs frequently leave memory allocated at exit time, since they know it will be freed by the operating system. Similarly, most programs don't bother to free some allocated resources that indirectly use allocated memory, such as the standard input, output, and error I/O streams.If you ignore these "normal" cases of memory left unfreed at exit time, analyzing this report allows you to detect more harmful memory leaks and logic errors. To generate the report of all blocks allocated by the process but not freed before the process exits, use the -u option to ZeroFault. The unfreed blocks will appear in the report produced by the Show Leaks button of the ZeroFault GUI (or you can use the zf_rpt command to view them in text form).
|